Rating R Packages
The new rOpenSci package packagemetrics is a new ‘meta’ package for R with info on packages: dependencies, how long issues take to be resolved, how many watchers on GitHub, and more. Let’s take a look at a few packages I use and some of my own. Install:
install.packages("formattable")
devtools::install_github("ropenscilabs/packagemetrics")
Then load the packages we’re going to use (I liked the table they have in their README, so I thought I’d keep with that style):
library(formattable)
library(packagemetrics)
library(dplyr)
Next, let’s get the packages I’m interested in and make our nice table:
packages <- list("dplyr", "tidyr", "tidyRSS",
                 "rstan", "rjags",
              "electionsBR", "tmap")


pd <- purrr::map(packages, combine_metrics) %>%
  data.table::rbindlist(fill=TRUE) %>%
  select(package, published, dl_last_month, stars, forks,
         last_commit, last_issue_closed,
         depends_count, watchers) %>%
  mutate(last_commit = round(last_commit, 1),
         last_issue_closed = round(last_issue_closed, 1))

pd[is.na(pd)] <- ""

formattable(pd, list(
    package = formatter("span",
                      style = x ~ style(font.weight = "bold")),
    contributors = color_tile("white","#1CC2E3"),
    depends_count = color_tile("white", "#1CC2E3"),
    reverse_count = color_tile("white", "#1CC2E3"),
    tidyverse_happy = formatter("span",
                                style = x ~ style(color = ifelse(x, "purple","white")),
                                x ~ icontext(ifelse(x, "glass","glass"))),
    vignette = formatter("span",
                         style = x ~ style(color = ifelse(x, "green","white")),
                         x ~ icontext(ifelse(x, "ok","ok"))),
    has_tests =  formatter("span",
                           style = x ~ style(color = ifelse(x, "green","red")),
                           x ~ icontext(ifelse(x, "ok","remove"))),
    dl_last_month = color_bar("#56A33E"),
    forks = color_tile("white", "#56A33E"),
    stars = color_tile("white", "#56A33E"),
    last_commit = color_tile("#F06B13","white", na.rm=T),
    last_issue_closed = color_tile("#F06B13","white", na.rm=T)
  ))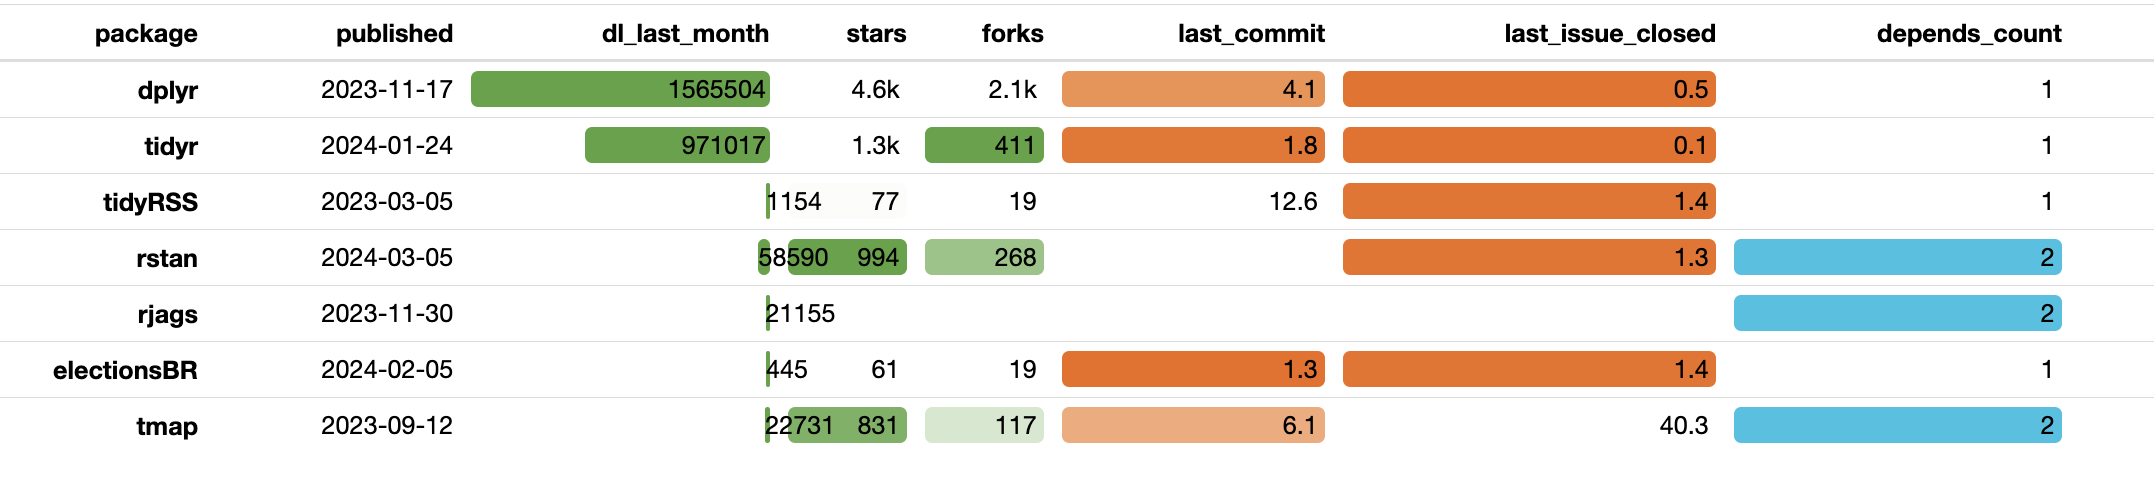
Nice table. It’s not perfect – maybe they still have some bugs to work out – but this is a nice little package. Still, there are so many packages out there that I still use them based on cool examples I see, either on blogs, twitter, or in academic papers. I’ve never much used the CRAN Task Views and I doubt I’ll use packagemetrics much, but it’s interesting for those who get their R this way.